Japan is the world's third-largest economy, behind only The United States and China. In 2017, it had a real GDP of $5.42 trillion and a nominal GDP of $4.87 trillion. Any growth or recession in the Japanese economy is both reflective and predictive of the world economy — it was rocked in 2008 during the financial crisis, and is still in the process of recovering. The United States has seen a similar path to recovery.
Economists study the past in order to predict the future. Traditionally, they look at stock and futures markets, bond and mortgage interest rates, exchange rates, and commodities. But what if other behavioral patterns could predict changes in the economy, and, ultimately, GDP?
We wondered the same thing, and stumbled upon something interesting.

The data
In December 2018, Tokyo Electric Power Company Holdings (TEPCO) ($TYO:9501) began publishing daily power utilization forecasts of peak time zones "when power utilization is at a maximum" in order to establish some transparency with both its customers and government officials. We began tracking the data and created a time series going back to 2016.
The experimental methodology
Aside from the fact that TEPCO runs the Fukushimi Daichi nuclear facility that suffered three meltdowns in the wake of the Tokou Earthquake of March 2011, it's also the electric utility company that services the Kanto region, which includes Tokyo, Japan's largest city. This also means that it services the largest region of Japan in terms of GDP. In fact, Kanto is more than two times the size of the second largest prefectural economy in Japan, Kinki (which includes Kyoto and Osaka).

Given the data's reliability and the size of the kanto region as a general representation of overall Japanese economic activity, we looked to find indications of correlation between energy demand and GDP. The results are, at the very least, useful, and point to the notion that energy demand can be predictive of economic activity.
The results
Our data, as sourced directly from TEPCO, goes back to March 2016. It's dense, as it's pulled on a daily basis, but one can see an uptick in the dead of summer and winter, as Japanese citizens were expected to use more energy to both cool and heat their homes.
By normalizing the data by quarter, we can see relative usage more as peaks and valleys. This also allows us to overlay the data with GDP as reported by the Japanese government.
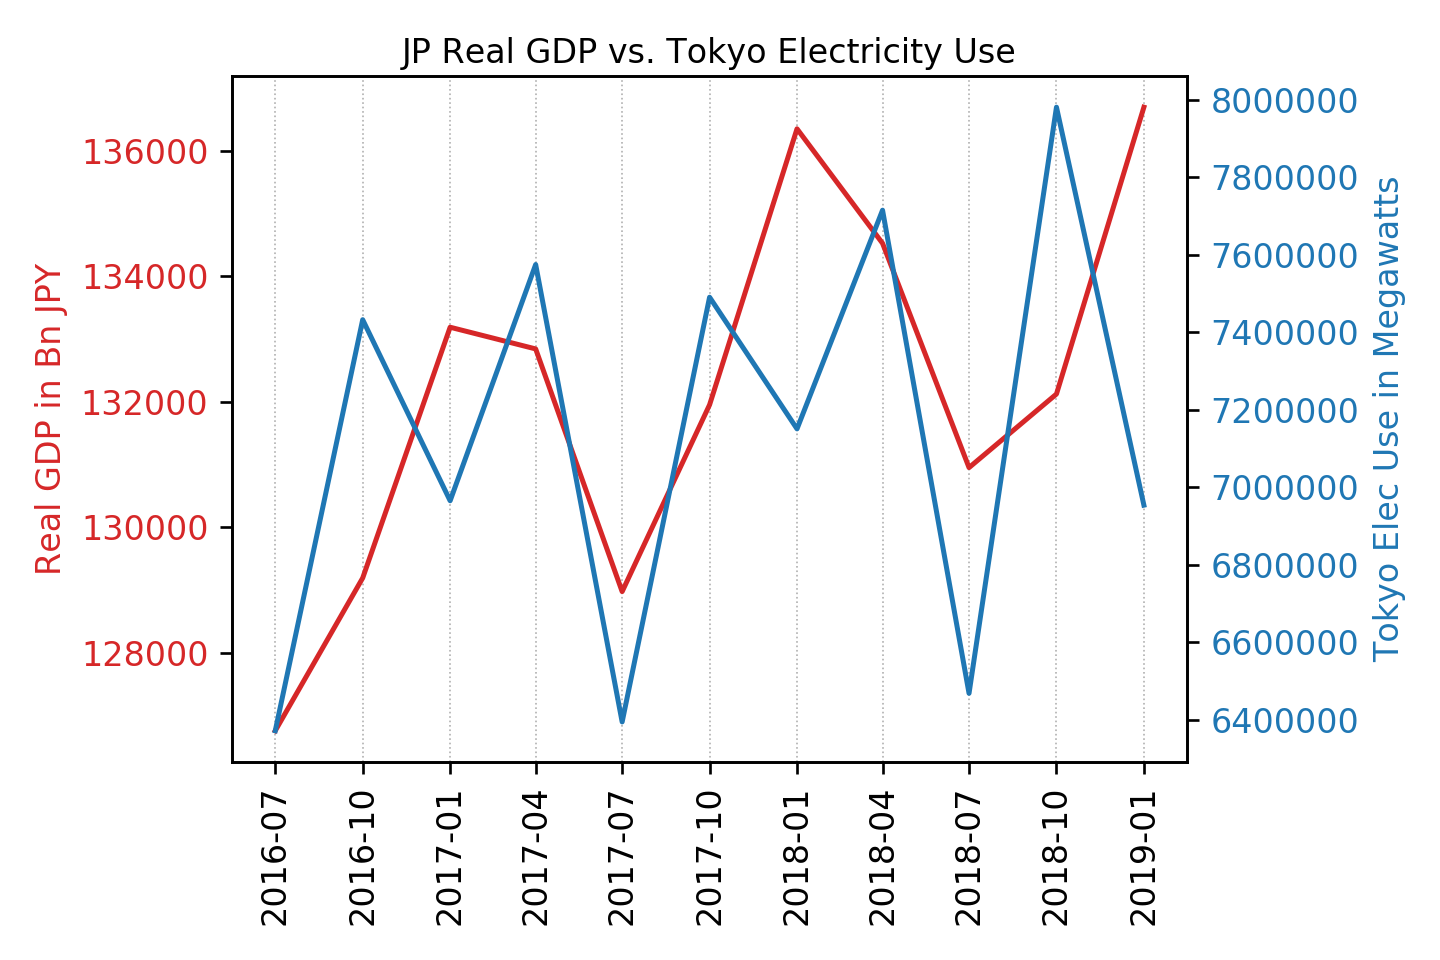
The overlay (do note the disparate Y axes) reveals a quarterly echo, where electric usage spikes anticipate real GDP. The relationship exists for Q3 and Q4 of 2016, Q3 and Q4 of 2017 leading into Q1 of 2018, and now Q3 and Q4 of 2018 leading into Q1 of 2019. That's a consistent relationship for three years running.
While a direct causative relationship is premature here, this newly discovered relationship between alternative data as supplied ty TEPCO matched with proven economic measurements (in this case real GDP) for a related economic bloc appears to be worth further tracking and perhaps even study.
Economists of the world, do get in touch with us if we're on to something here.